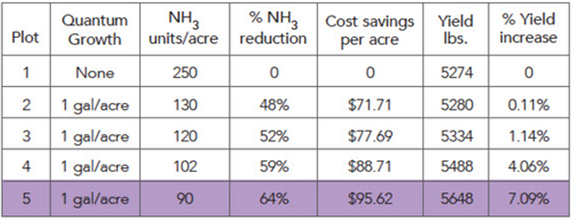
Extrapolated per acre yields
1 gram = 0.00220462262
lbs.
1 acre = 43,560 ft²
1 acre = 2,178 (20 ft²) test plots
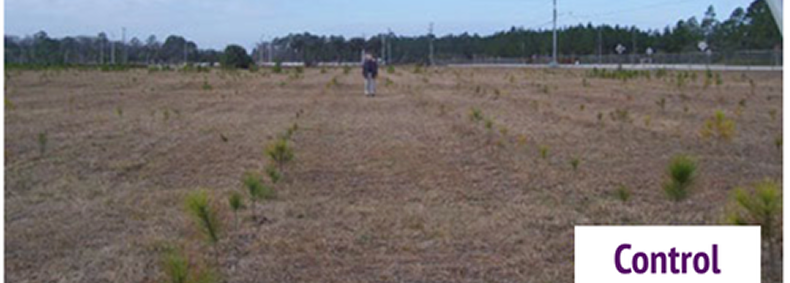
Control plot per acre yield
1 gram = 0.00220462262
lbs.
1 acre = 43,560 ft²
1 acre = 2,178 (20 ft²) test plots
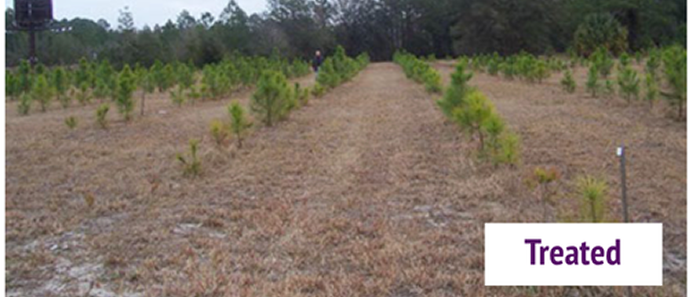
Treated plot per acre yield
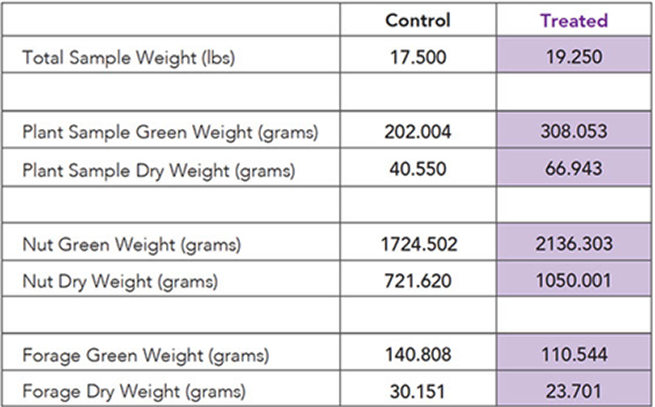
1050.001 grams per 20 ft² test plot
2,286,902.178 grams per acre
5,042 pounds per acre
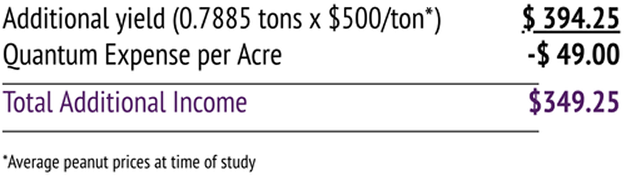
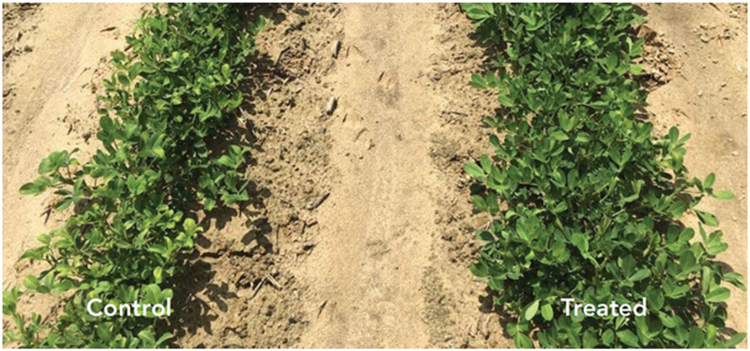
45.5% increase in yield. Assuming no other costs were incurred, the net benefit is an additional 69% in profit.
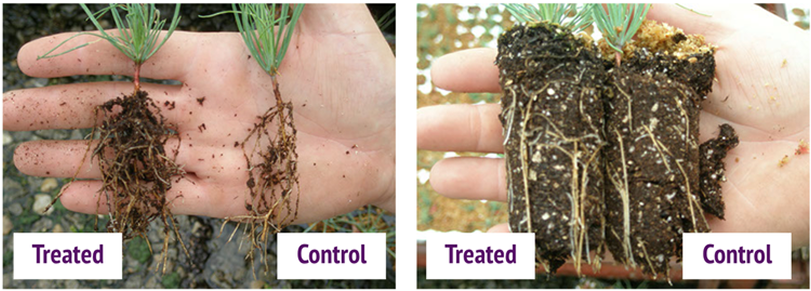
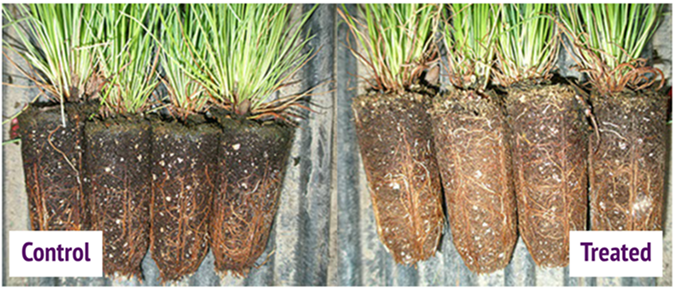
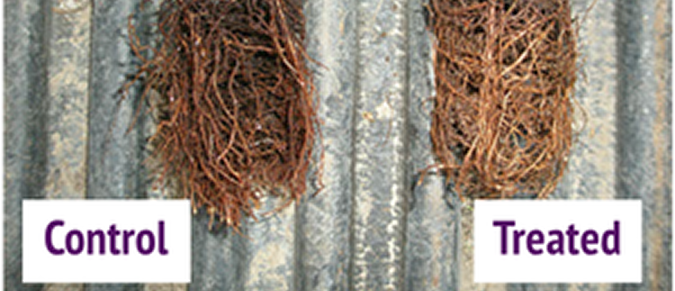
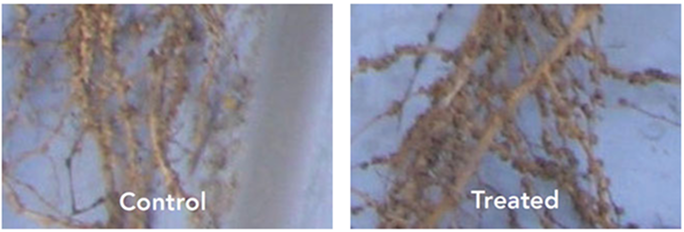
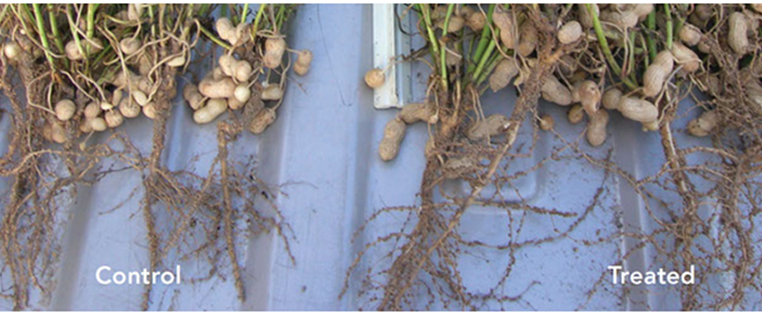
Root Nodulation
This shows the visible difference in nodule density between the control and treated samples.